
In my previous post, I discussed the benefits of stating explicit rationale for rearing advancements (diet or other rearing system components development and improvement as well as developing SOPs). In the current post, I will guide readers through an example of a HOW and WHY type of inquiry.
We discover HOWs and WHYs of materials and processes by doing experiments. For years, my research (from about 1975-2010) was done in the old “one factor at a time (= OFAT)” experiments. My progress was slow, time consuming, and IT NEVER GAVE ME MUCH INSIGHT INTO INTERACTIONS IN MY EXPERIMENTAL REARING SYSTEMS. In writing my first book: Cohen 2003, Insect Diets: Science and Technology, CRC Press Boca Raton, FL, I wrote that diet experiments (and by implication other kinds of rearing experiments) must be done one factor at a time; but a colleague from the USDA, Agricultural Research Service, Dr. Steve Lapointe wrote a criticism of my OFAT statement and excellently pointed out [Lapointe, S. L., T. J. Evens, and R. P. Niedz. 2008. Insect diets as mixtures: optimization for a polyphagous weevil. J. Insect Physiol. 54: 1157–1167. ] the insect diets are mixtures, and as mixtures they could be treated with multiple factor designs such as design of experiments (which was originated about 75 years before my insect diet book). [background on R.A. Fisher’s works on multiple factor experiments: R.A. Fisher book: Design of Experiments. 1935. Edinburgh: Oliver and Boyd Ltd. Pp. 1-252. Amazingly, the 1935 Fisher book was an outgrowth of Fisher’s earlier works on engineering of optimization from the mid-1920s (Box, J. F. (1980). “R.A. Fisher and the Design of Experiments, 1922-1926” The American Statistician. 34 (1): 1–7. doi:10.2307/2682986 – via JSTOR.)]
This leads to my approach to understanding the HOWs and WHYs or discovery of the nature of Yamamoto Diet components as they interact in the diet, taking us back to the design of experiments inquiry that I did with the help of JMP Statistics Software and resulting in this table:
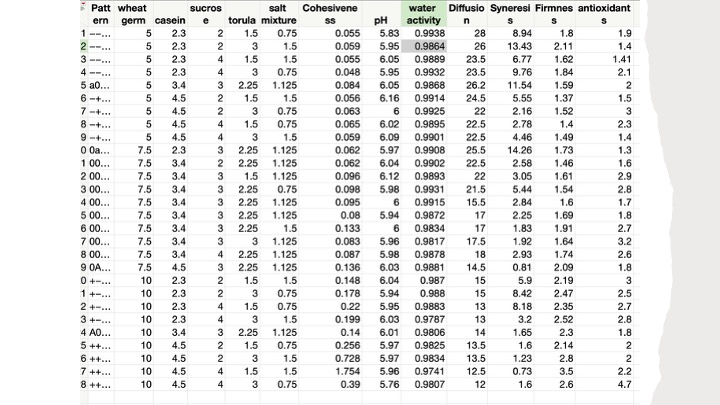
Table 1. Design of experiments setup prescribed by JMP software for testing Yamamoto Diet factors and responses.
In this experiment, after inputting the diet parameters (factors) that I wanted to examine and the outcomes (responses) that I wanted to measure, I made up the 28 diets specified by JMP and seen in the columns titled Wheat Germ, Casein, Sucrose, Torula Yeast, and Salt Mixture. Telling JMP the ranges of the components (factors) I wanted to test, the amounts in the above table were specified, and it should be noted that each line or row represents one run (for a total of 28 runs).
I then measured the 7 responses (cohesiveness, pH, water activity, diffusion rate, synergism, firmness, and antioxidant capacity) and obtained the values specified in each of the columns in Table 1. This data table reflects a huge amount of information and understanding that we can glean from this inquiry-based approach to understanding diets and other rearing systems components and interactions. I then used this table for a neural network analysis also supported by JMP. After selecting the 5 factors and the 7 responses in this dataset, I started a neural analysis with a Gaussian distribution goal and got the following diagram:
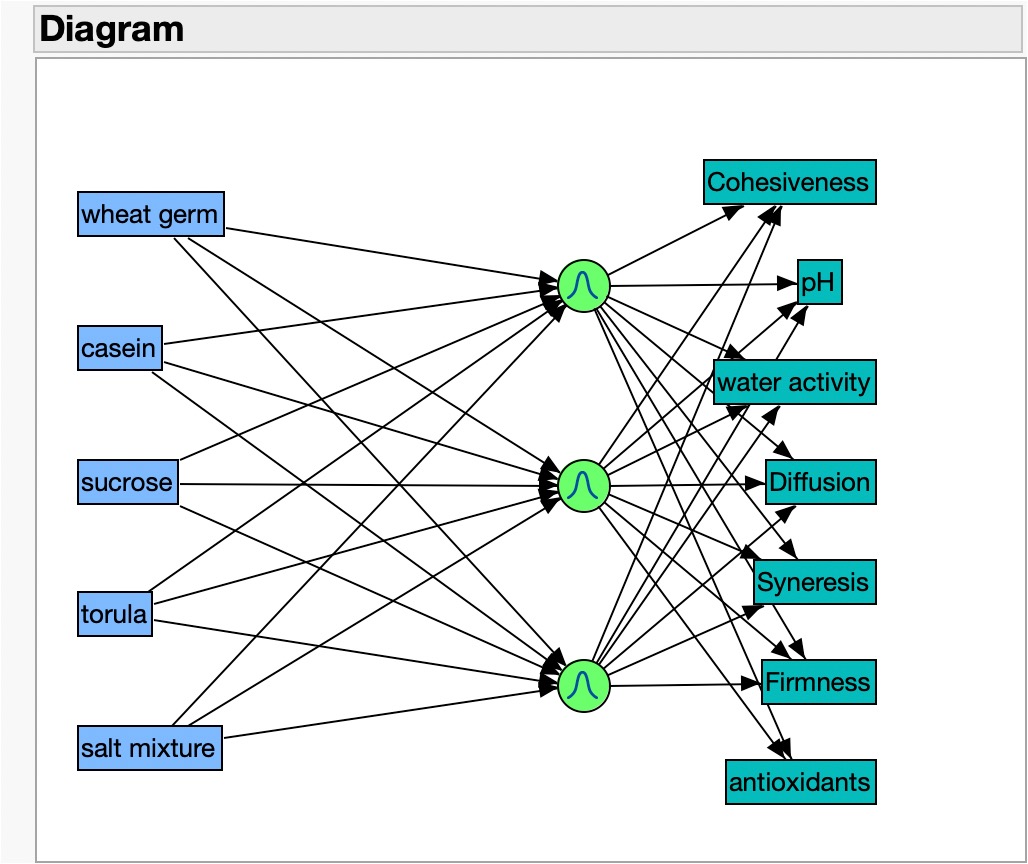
Figure 2. Yamamoto Diet neural network analysis diagram showing inputs (in blue rectangles), the neural nodes (in light green circles), and the outputs (in dark green rectangles). Using the Profiler Analysis in JMP, the following graph set was obtained:
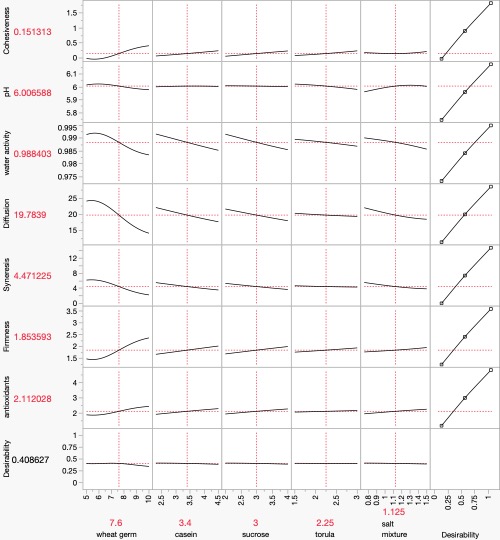
Figure 3. JMP Profile of Neural Analysis of Yamamoto Diet factors and responses. Please note from this figure that at a glance we can evaluate (and understand) how, for example, wheat germ in different concentrations affects cohesiveness, revealing that as wheat germ increases, cohesiveness increases. At the same time, as wheat germ increases, water activity and rate of diffusion both decrease while firmness is substantially increased. We can go through all the parameters (or factors) to see how they affect the physical-chemical responses of the diet. For now, suffice it to say that these tools, design of experiments and neural networking allows us to use data-based analysis of physical and biological responses to manipulation of various rearing factors.
Using DoE and Neural analyses, we can further explore relationships between the various factors in the experiments and their responses using 3D surface plotting as seen in two of many possible examples where we see the dynamics of wheat germ concentrations and casein as they affect diet pH and salt mixture and casein effects on pH.
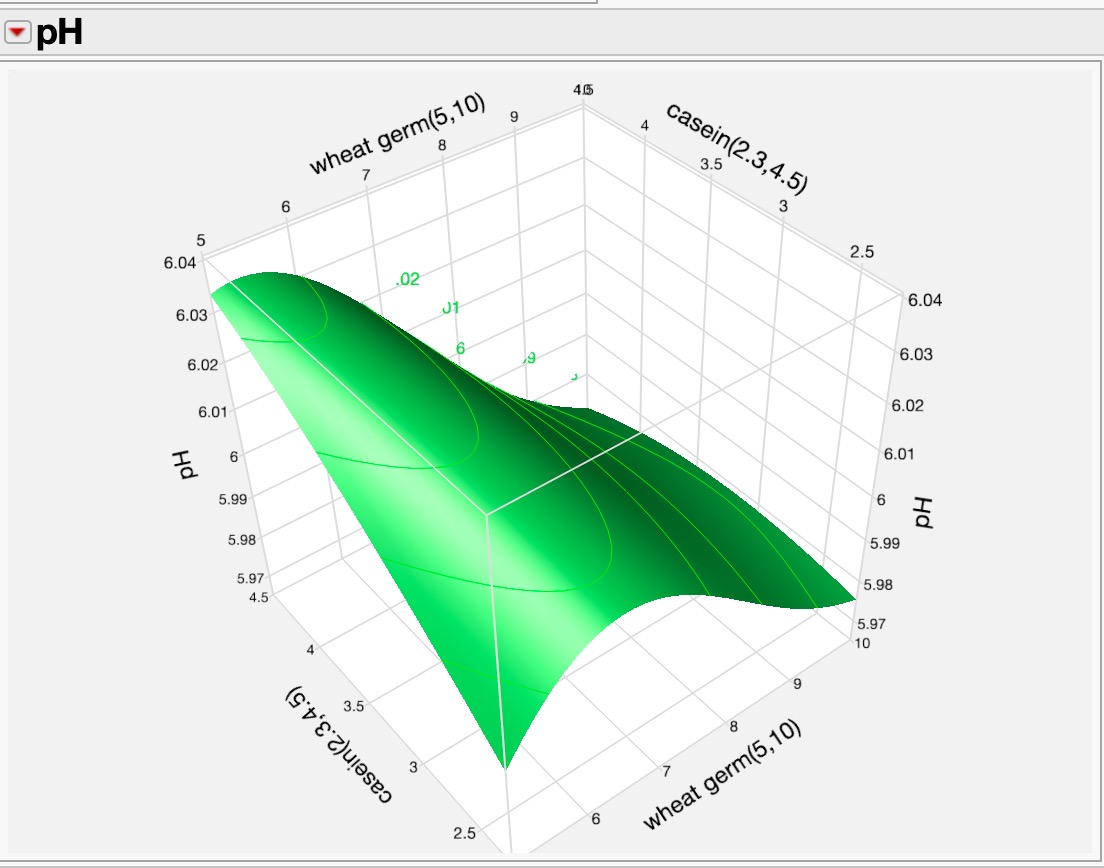
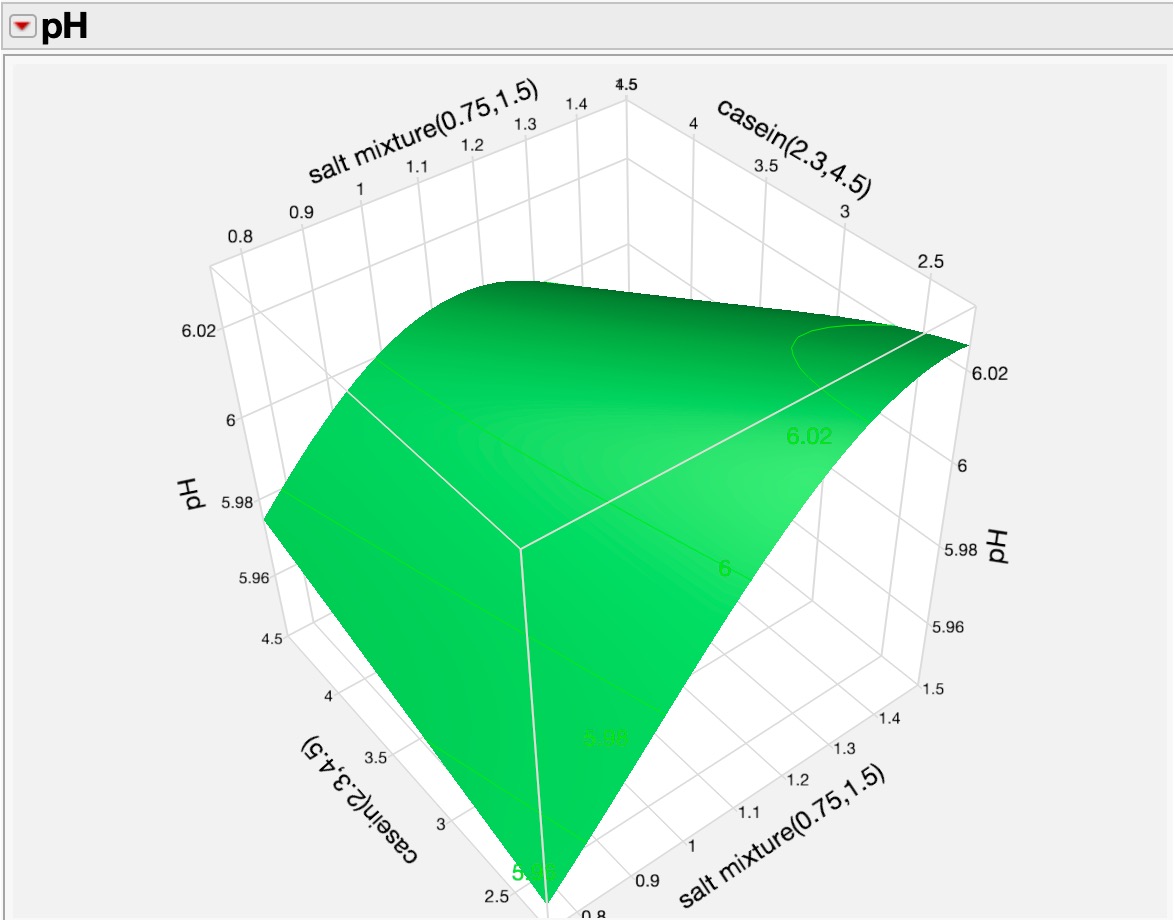
Figures 4a (pH v. wheat germ v. casein) and 4b (pH v. salt mixture v. casein v). This narrative is getting long, so I will stop for right now and resume the discussion soon.
But just to summarize, I hope that I have sparked some interest in the value of using multiple factor analysis as a DoE exploration, and that I have further stimulated readers to be curious about a neural network type analysis of insect rearing systems components. By way of advertisement, this is also an important part of my approach to my online classes in insect rearing.