
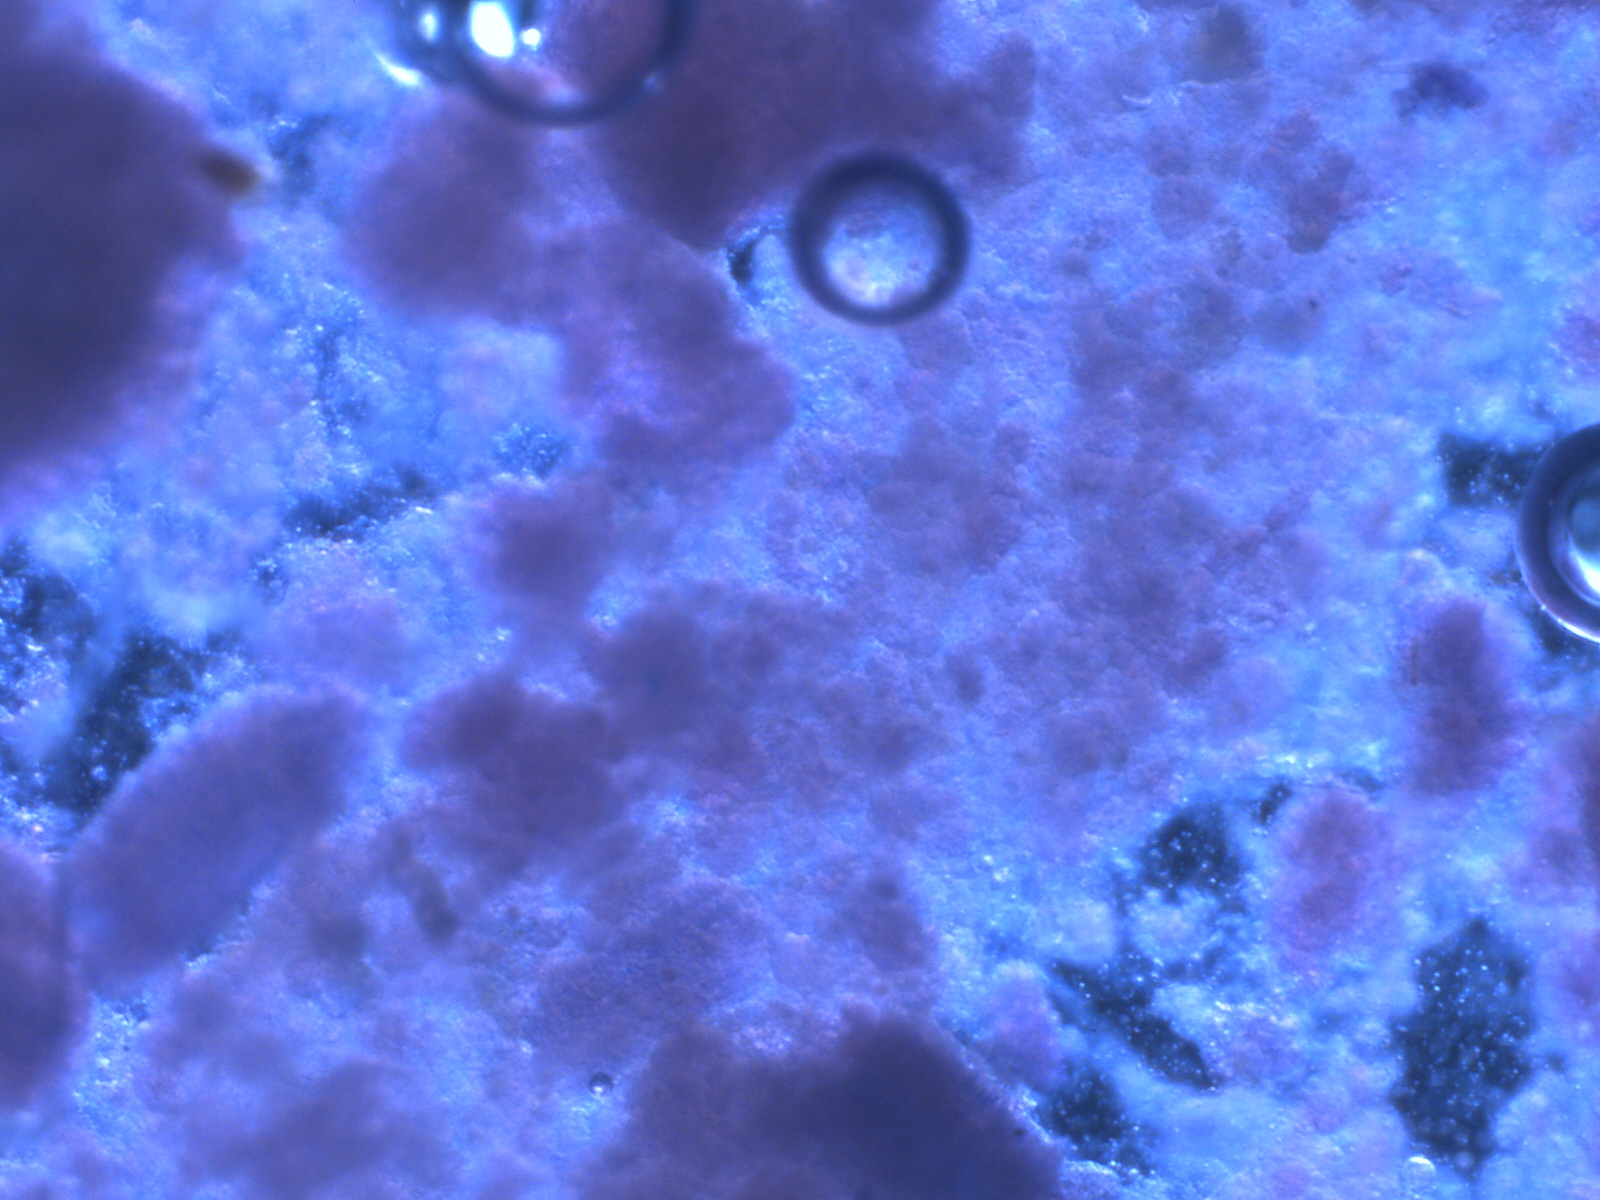
In yesterday’s post, I discussed the matrix concept in insect diets. I used an example of a visual treatment of a diet matrix using an image of a stained wheat germ-based diet viewed and photographed under about 20 x magnification in a video microscopy system. The basic image looked like this:
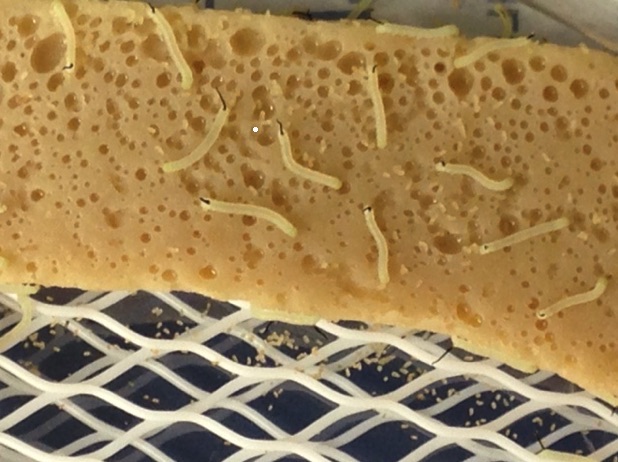
In the above images, the lower image shows a 1 x 3 cm section of diet with hornworms consuming the diet. The neonates (newly-hatched 1st instar larvae) depend upon finding all the nutrients they require within a small area of the diet where all lipids, protein, carbohydrates, minerals, and vitamins must be present in adequate amounts to support healthy growth. The upper image shows the granular nature of the diet whose particles (which are suspended in an agar or carrageenan framework) have an organization that can be thought of as conforming to a network, matrix relationship. This relationship (the granulometery) contributes to the potential for structural integrity, resulting in diet consistency and texture. There is also a great deal of potential chemical interaction such as lipid-binding by lipoproteins, carbohydrate-protein interactions, enzymatic and oxidative reactions, diffusion of solutes or nano-particles that are involved in the diet’s taste/texture qualities (palatability), the availability of nutrients within the reach of the insect’s mouthparts; then upon ingestion, the particles and solutes must be available for digestion and absorption. Finally, the arrangement of the particles and other diet components must lend itself to the diet’r retention of palatability, nutritional value, and bioavailability in a framework that we call stability. All the physicochemical characteristics and interactions constitute the diet’s MATRIX.
In these images, there is an implicit matrix organization that dictates or commands the nature of the diets in question. To better understand this matrix/organization feature, we can examine the following diagram:
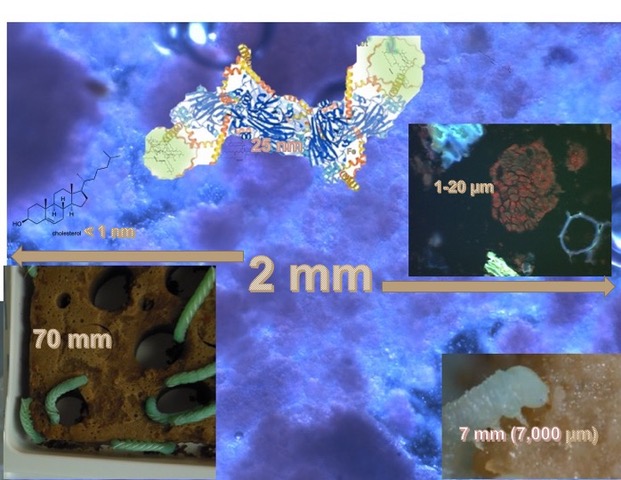
In the above diagram (partly explained in the image caption), the various levels of organization are shown from macro- to nano levels. The inset on the right-central part of the diagram is a fluorescent micrograph of the diet that was stained with the lipid stain, Nile Red, which shows the lipids in a 20 micron particle of wheat germ. Other fragments in this insect (against the black background) are brightly-coloured carbohydrates, which stain blueish with Nile Red. The upper central portion is a diagram of a large lipoprotein molecule of about 25 nm x 5 nm, and on the left central portion a sterol molecule is depicted as a less than 1 nm structure. The lipoprotein molecule contains hydrophobic pockets (the greenish structures on the left and right ends of the molecular structure). It is the hydrophobic pockets in lipoproteins that bind with and carry lipids (= lipophorins). Throughout this diagram, it is evident that there are micro-relationships on the physicochemical level of organization, and these relationships lead to degrees of stability, nutrient bioavailability, and taste (palatability). An important part of this relationship is in the interactions between particles and liquid interfaces, and we will further explore these in relationships that we study with granulometry.